5. Understanding your report
This chapter walks through a real report section by section, and — more importantly — tells you what to do with each part. The example below is an analysis of a well-known public video (Rick Astley — "Never Gonna Give You Up"), used here for illustration.
Open a report by selecting a video from your Results or History. On the left is a Chapters list that jumps you to any section. At the top are the report actions: Watch on YouTube, Export, Re-analyze, and Find frames.
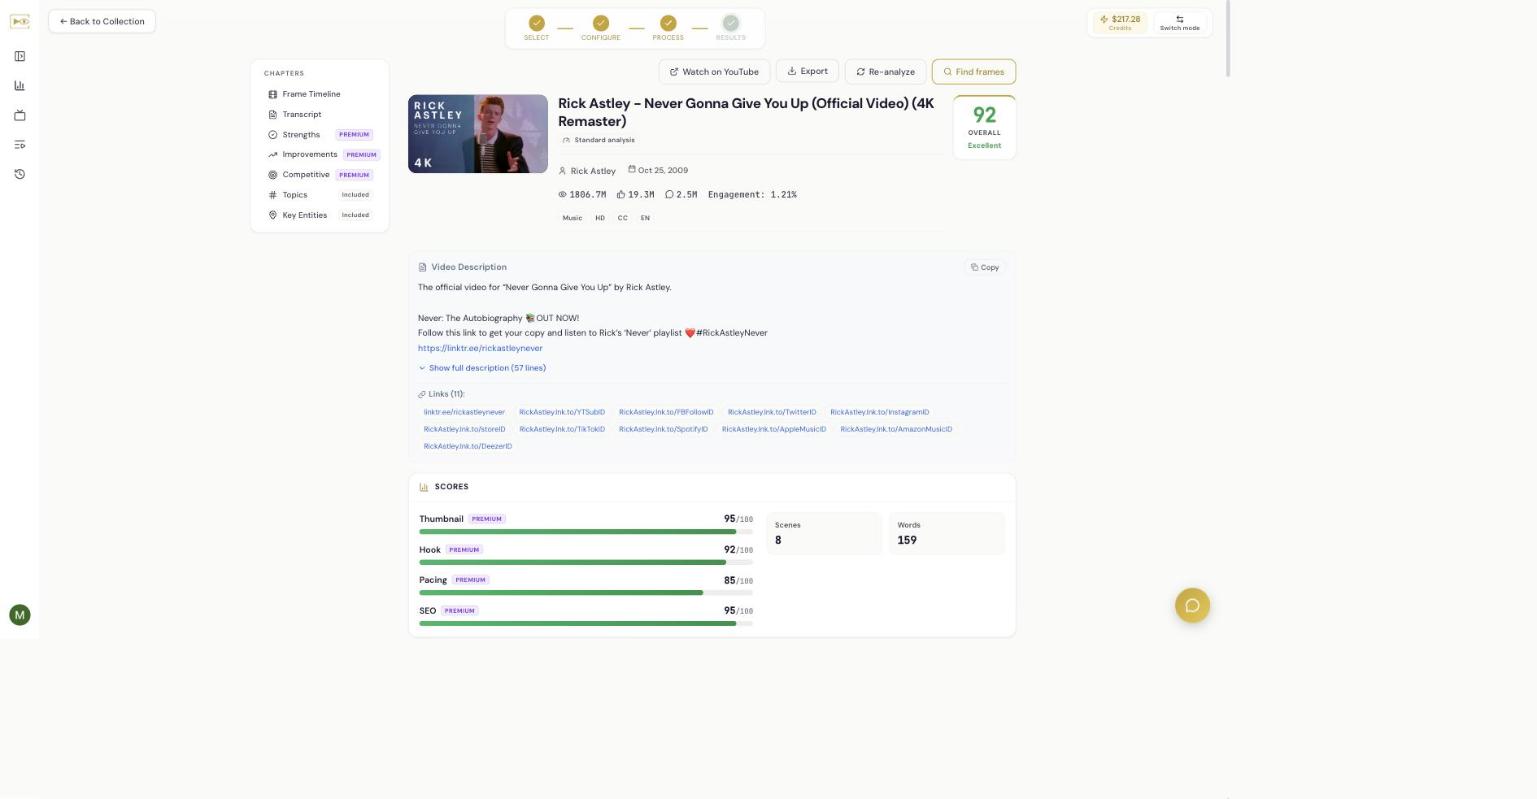
The header and overall score
The header shows the video's title, author, publish date, view/like/comment counts, engagement rate, and the analysis depth used. The large number on the right is the Overall score out of 100 with a plain-language label (for example, Excellent). Treat it as a quick read, not a verdict — the section scores below tell you where to focus.
Scores card
The Scores card breaks the overall number into the parts that drive it — Thumbnail, Hook, Pacing, and SEO, each out of 100 — plus quick facts like the number of scenes and words. What to do: find your lowest score and start there. A strong video with a weak hook is losing viewers in the first seconds; a strong hook with weak SEO is being watched but not found.
Frame Timeline
A scene-by-scene visual breakdown of everything in the video, with the number of scenes detected. What to do: scan for where the visuals go flat or repeat. If several scenes in a row look the same, that's where attention drops.
Transcript
The full timestamped transcript of all speech. What to do: use it to find your actual hook wording, spot filler, and pull quotes for titles, descriptions, or captions.
Premium insight sections
These appear when you include Premium Insights in the analysis (see Chapter 17):
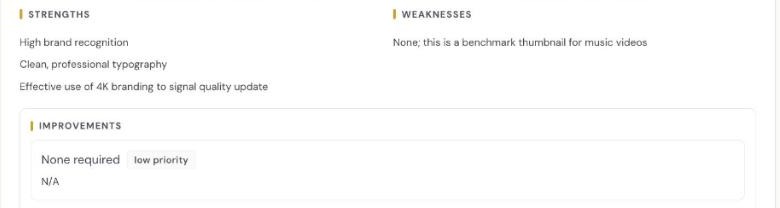
- Thumbnail Assessment — strengths, weaknesses, a mobile-size test, and clickbait risk. Fix the weaknesses it names before you fix anything else about the thumbnail.
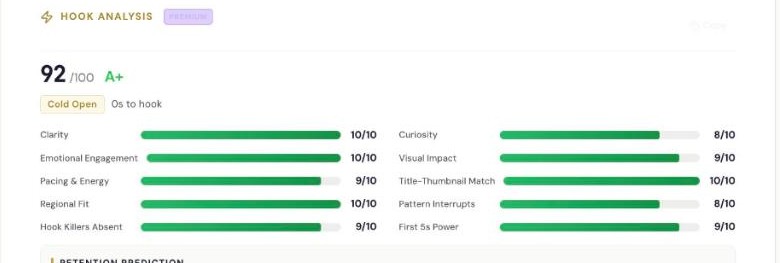
- Hook Analysis — how the opening performs, scored out of 100 with a grade, plus sub-scores (clarity, curiosity, emotional engagement, pattern interrupts, first-5-seconds power) and a retention prediction with specific improvements. Rewrite or re-cut the first 3–10 seconds using its suggestions.
- Pacing Analysis — attentional capture, information velocity, structural rhythm, and a timeline of strong and weak segments. Tighten or cut the segments it flags as weak.
- Audio Health — speech intelligibility, listening effort, perceived speech level, level consistency and voice-vs-background, described perceptually (never in dB or LUFS), plus a background-noise chip for each affected moment — click one to hear it — and a plain “verify the numbers yourself” routine. Address the specific moments it lists.
- Strengths & Improvements — what's working and the concrete changes to make. This is your to-do list.
- SEO & Keywords — quick wins, a primary keyword, secondary and long-tail keywords, optimized title suggestions, and recommended tags. Apply the quick wins and try a suggested title.
- Competitive Notes — positioning, differentiation, production quality, audience fit, content gaps, and recommendations. Use the content gaps to plan your next videos.
Topics and Key Entities
Topics Covered maps the major themes (enriched by AI when premium insights are on). Key Entities & References lists the places, brands, people, and products detected in the video. What to do: check that your intended topic actually comes through, and use the entities to inform tags and descriptions.
The same report for videos you upload
The example above is a YouTube video, but you get this exact report — every section and every premium insight — for videos you upload too (see Chapter 3). The scores, Frame Timeline, Transcript, Hook, Pacing, Thumbnail, SEO, Competitive, Audio Health, Topics, and Key Entities are all generated from the video's own content, so they apply to any video, whatever platform it came from, as long as you own it or have the rights.
Two honest differences for an uploaded video:
- No public YouTube stats. The header's view, like, and comment counts and engagement rate come from YouTube, so they aren't shown for a private upload. Everything derived from the video itself is unchanged.
- Find frames extracts real frames. For an upload, Find frames pulls the actual image frames out of your file into a downloadable gallery; for a YouTube URL it gives you timestamps and links instead (see Chapter 18).
The disclaimer
Every report carries this line, and it's worth reading:
Independent AI-generated analysis. Not affiliated with or endorsed by YouTube. May contain errors.
The report is a well-informed second opinion from an AI that watched your video. It is not ground truth. Use its specific, checkable suggestions; sanity-check anything that surprises you.
Saving and sharing
Use Export to download the report (see plan limits on included PDF exports in Chapter 14). You can also open Chat with your analysis to ask follow-up questions about the report.
Topics as a mind map
The Topics module has a Mind Map view — topics, subtopics, timestamps and correlations, with an interactive HTML export. See Chapter 9.
Repackaging
The Repackaging module drafts stronger titles, a description, chapters, thumbnail concepts (each pointing at a frame) and tags for an already-published video — copy any field straight into your upload form. Repackaging & metadata is generated on demand and metered by tokens like other AI generation, with the estimate shown first.
Every timestamp is a link
Click any timestamp in the report to play that moment in the player at the top — see Chapter 6.
From report to feedback
When you know what to change, choose Feedback to write the fix on each moment and export an editor-ready feedback.md (Chapter 7), or Collab to review it with someone else live (Chapter 8).
Related
Independent AI-generated analysis. Not affiliated with or endorsed by YouTube. May contain errors.